- Telecommunications Giant Vodafone Leaves the Libra Association
- Group of Central Banks Assesses Developing Central Bank Digital Currencies
- South Korea Might Impose 20 Percent Tax on Cryptocurrency Profits
- Report: Terrorists Increasingly Use Crypto to Raise Funds Anonymously
- Canadian Securities Administrators Subject Crypto Exchanges to Securities Laws
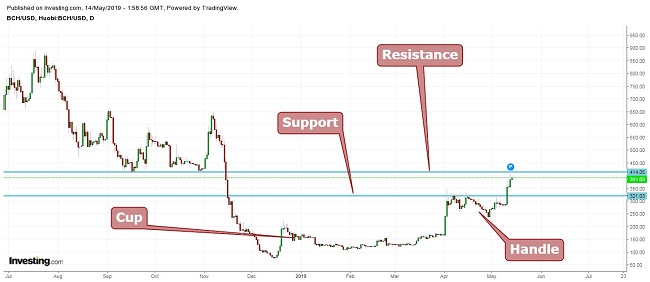
Bitcoin Cash Price Technical Analysis (May 14): On the Verge of Another Bull Rally

Bitcoin Cash (BCH) is currently trading at around $404. Looking at the chart, we can see that the price is in a strong uptrend movement after a minor correction.
Also, we can see a formation of cup and handle pattern (similar to BTC’s recent movements); it is a very bullish pattern. The buying point was at around $325. Currently the price is approaching its resistance at $408 with support at $330.
Dow Theory
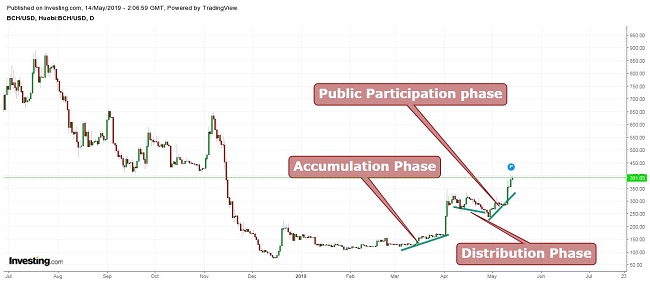
According to Dow Theory, the price is in the public participation phase. During this phase, negative sentiment starts to dissipate. As the good news starts to permeate the market, more and more investors move back in, sending the prices higher. This phase tends not only to be the longest lasting, but also the one with the largest price movement.
It is also the phase in which most technical and trend traders start to take long positions. We also saw features of the distribution phase in between, which is represented by the topping of the market where the price movement starts to flatten as selling pressure increases.
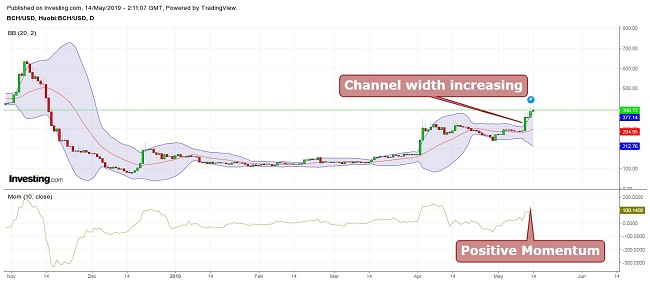
Bollinger Bands
Bitcoin Cash’s price was moving between the channels. Recently we saw that the top channel started expanding with the price breaking out of the channel. This indicates a major price activity, combined with momentum indicator, which is a strong and positive sign that the price is expected to go up.
Moving Average
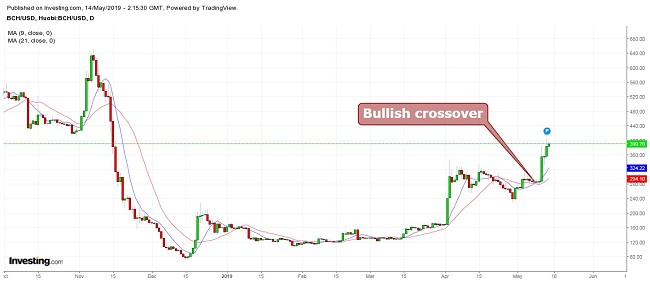
When taking 9 period moving averages (blue) with 21 period moving averages (red), it indicates a positive trend with a bullish crossover as the price moving above the 9 period moving average.
Conclusion
Bitcoin Cash (BCH) is currently trading at around the $400 level. The resistance is at $408 with support at $330. There is a formation of a cup and handle pattern, which is bullish pattern. Currently the price is approaching its resistance; it is suggested to take position only after the price crosses the resistance or is around the support.
Considering other indicators, we get bullish signals. As per the Dow Theory, the price is in the participation phase, but after the accumulation phase, we saw a glimpse of the distribution phase, which is not a good sign. Therefore, it is recommended to wait for price to close above resistance. Swing trading is not suggested as a major price correction is not expected. Overall, the outlook is bullish.
Pivot Points
| Name | S3 | S2 | S1 | Pivot Points | R1 | R2 | R3 |
| Classic | 0.03469 | 0.03885 | 0.04393 | 0.04808 | 0.05316 | 0.05731 | 0.06239 |
| Fibonacci | 0.03885 | 0.04237 | 0.04455 | 0.04808 | 0.05161 | 0.05379 | 0.05731 |
| Camarilla | 0.04648 | 0.04733 | 0.04817 | 0.04808 | 0.04986 | 0.05071 | 0.05156 |
| Woodie’s | 0.03517 | 0.03909 | 0.04441 | 0.04832 | 0.05364 | 0.05755 | 0.06287 |
Technical Indicators
| Name | Value | Action |
| RSI(14) | 48.297 | Neutral |
| STOCH(9,6) | 53.934 | Neutral |
| STOCHRSI(14) | 60.974 | Buy |
| MACD(12,26) | -0.004 | Sell |
| ADX(14) | 29.160 | Sell |
| Williams %R | -52.151 | Neutral |
| CCI(14) | 49.1498 | Neutral |
| ATR(14) | 0.0080 | Less Volatility |
| Highs/Lows(14) | 0.0003 | Buy |
| Ultimate Oscillator | 50.555 | Neutral |
| ROC | 40.353 | Buy |
| Bull/Bear Power(13) | 0.0057 | Buy |
: On the Verge of a Bull Run?")
: Trending Sideways After the Big Rally")
: Bullish Patterns Indicate Another Rally")
 Price Technical Analysis (May 30): It's a Bull!")
: A Correction After a Rally to Come?")
Digital favorites
- Siti Di Scommesse
- Casino Bonus Senza Deposito Immediato
- Best Casinos Not On Gamstop
- Casinos Not On Gamstop
- UK Casinos Not On Gamstop
- Non Gamstop Casinos
- UK Casinos Not On Gamstop
- Casino Not On Gamstop
- Non Gamstop Casino
- Slots Not On Gamstop
- Meilleur Casino En Ligne France
- Gambling Sites Not On Gamstop
- オンライン カジノ おすすめ
- Gambling Sites Not On Gamstop
- Non Gamstop UK Casinos
- UK Casino Sites Not On Gamstop
- UK Casinos Not On Gamstop
- Non Gamstop Casinos UK
- Non Gamstop Casino Sites UK
- Best Slot Sites
- UK Online Casinos Not On Gamstop
- Best Non Gamstop Casino
- Best Sports Betting Sites Not On Gamstop
- Meilleur Casino En Ligne
- Migliori Casino Online
- Meilleur Site De Casino En Ligne
- Pari Sportif Belgique
- Siti Casino
- Paris Sportif Tennis
- Meilleur Site De Paris Sportif International
- 익명 카지노
- Fm 카지노
- Casino Sans Verification
- Real Money Casino App No Deposit
- Siti Non Aams Bonus Senza Deposito
- Casino Non Aams
- Meilleur Casino En Ligne Belgique
- Site De Poker
- Casino En Ligne 2026
- Meilleur Casino En Ligne 2026
- Casino Con Crypto
- Casino Online Non AAMS
- Casino En Ligne Crypto
- I Migliori Siti Di Poker Online
- Giocare A Poker Online Con Soldi Veri