- Telecommunications Giant Vodafone Leaves the Libra Association
- Group of Central Banks Assesses Developing Central Bank Digital Currencies
- South Korea Might Impose 20 Percent Tax on Cryptocurrency Profits
- Report: Terrorists Increasingly Use Crypto to Raise Funds Anonymously
- Canadian Securities Administrators Subject Crypto Exchanges to Securities Laws
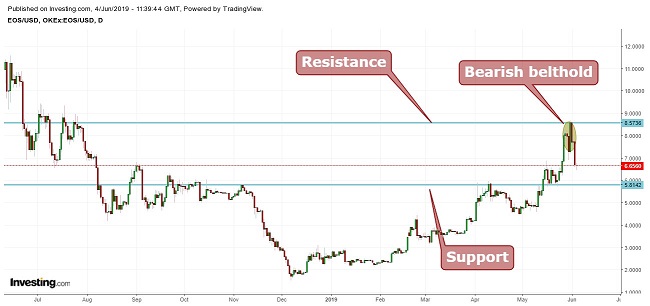
EOS Price Technical Analysis (June 4): Uptrend but Indecisive
EOS (EOS)trade is currently trading at $6.84. The price was in an uptrend but there was a formation of a bearish belt hold pattern at the resistance level. It is a trend reversal pattern indicating resistance.
Minor support is at $6.33 and major support is at $5.81 with resistance at $8.57. It is suggested not to take long position at this price.
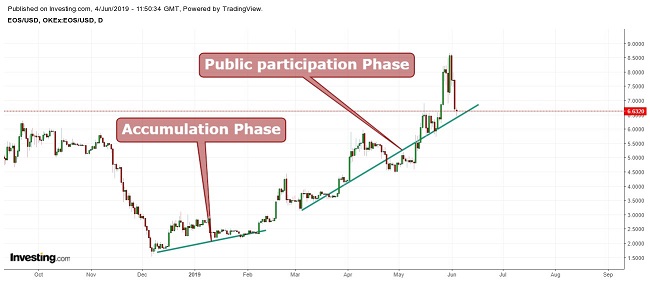
Dow Theory
According to Dow Theory, the digital coin is currently appearing in the public participation phase; during this phase, negative sentiment starts to dissipate. This phase tends not only to be long lasting, but also the one with the largest price movement potential. It is also the phase in which most technical and trend traders start to take long positions. The trendline is also acting as support.
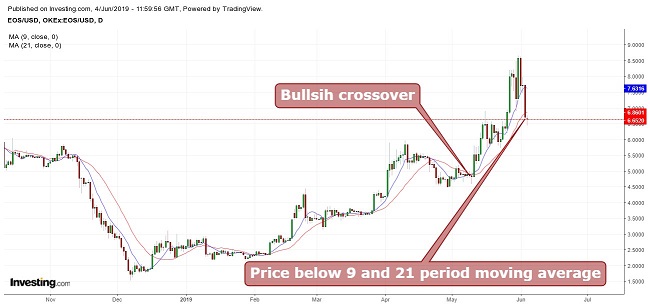
Moving Average
Taking 9 period moving averages (blue) with 21 period moving averages (red), although, there is bullish crossover but the price is below nine and twenty-one period moving averages indicating correction.
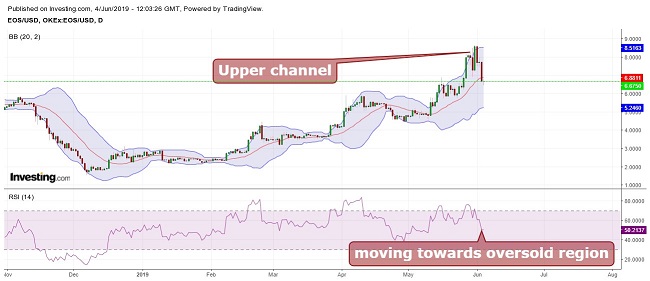
Bollinger Bands
The price is moving between the channels, with the upper limit acting as resistance. The price after touching the upper limit is declining indicating further correction. The middle average line can act as support. The downward breakout can be false wait for the confirmation.
Conclusion
EOS is currently trading at $6.84. The support is at $5.81 with resistance at $8.57. It is suggested to wait until the price touches the support or minor support of $6.43. The above levels can be used for swing trading.
The current momentum is negative but the formation of doji indicates indecision; also, the RSI is moving towards the oversold region. The overbought region can act as a buying point. The midterm target is $10.70.
Pivot Points
| Name | S3 | S2 | S1 | Pivot Points | R1 | R2 | R3 |
| Classic | 3.9324 | 5.0667 | 6.3894 | 7.5237 | 8.8464 | 9.9807 | 11.3034 |
| Fibonacci | 5.0667 | 6.0053 | 6.5851 | 7.5237 | 8.4623 | 9.0421 | 9.9807 |
| Camarilla | 7.0363 | 7.2615 | 7.4868 | 7.5237 | 7.9372 | 8.1624 | 8.3877 |
| Woodie’s | 4.0264 | 5.1137 | 6.4834 | 7.5707 | 8.9404 | 10.0277 | 11.3974 |
Technical Indicators
| Name | Value | Action |
| RSI(14) | 61.467 | Buy |
| STOCH(9,6) | 51.047 | Neutral |
| STOCHRSI(14) | 60.943 | Buy |
| MACD(12,26) | 0.536 | Buy |
| ADX(14) | 46.327 | Buy |
| Williams %R | -35.306 | Buy |
| CCI(14) | 145.4924 | Buy |
| ATR(14) | 1.0549 | High Volatility |
| Highs/Lows(14) | 0.9996 | Buy |
| Ultimate Oscillator | 51.850 | Buy |
| ROC | 92.927 | Buy |
| Bull/Bear Power(13) | 3.4640 | Buy |
: Indecisive Ascent")
: Looking Up to $13,000")
: Going Up to Resistance")
: A Correction After a Rally to Come?")
Digital favorites
- Siti Di Scommesse
- Casino Bonus Senza Deposito Immediato
- Best Casinos Not On Gamstop
- Casinos Not On Gamstop
- UK Casinos Not On Gamstop
- Non Gamstop Casinos
- UK Casinos Not On Gamstop
- Casino Not On Gamstop
- Non Gamstop Casino
- Slots Not On Gamstop
- Meilleur Casino En Ligne France
- Gambling Sites Not On Gamstop
- オンライン カジノ おすすめ
- Gambling Sites Not On Gamstop
- Non Gamstop UK Casinos
- UK Casino Sites Not On Gamstop
- UK Casinos Not On Gamstop
- Non Gamstop Casinos UK
- Non Gamstop Casino Sites UK
- Best Slot Sites
- UK Online Casinos Not On Gamstop
- Best Non Gamstop Casino
- Best Sports Betting Sites Not On Gamstop
- Meilleur Casino En Ligne
- Migliori Casino Online
- Meilleur Site De Casino En Ligne
- Pari Sportif Belgique
- Siti Casino
- Meilleur Site De Paris Sportif International
- 익명 카지노
- Fm 카지노
- Casino Sans Verification
- Real Money Casino App No Deposit
- Siti Non Aams Bonus Senza Deposito
- Casino Non Aams
- Meilleur Casino En Ligne Belgique
- Site De Poker
- Casino En Ligne 2026
- Meilleur Casino En Ligne 2026
- Casino Con Crypto
- Casino Online Non AAMS
- Casino En Ligne Crypto
- Giocare A Poker Online Con Soldi Veri